Water Testing 2023
letter from the VDM biologist SAMANTHA RHAINDS…
Hello all,
This email aims to advise all volunteers that reports regarding water quality for the 2022 season are now available on the municipal website. This year the municipality begun to conduct additional testing on a few lakes. These additional surveyed aimed to obtain a profile of the lakes based on depth. Throughout the 2023 season, the municipality will continue to conduct these survey on the lakes targeted in phase 1 of the programs with the objective to conduct a profile on all 47 lakes of the phase 1 before 2024.
Multiple improvements will start to come together in the next few months and you will soon see a water quality monitoring program which has been improved and bettered. In fact, in collaboration with a non-profit called ‘Water rangers’ funded in Val-des-Monts, we will offer a sampling kit completely revamped as well as support documents completely redesigned. We will also offer an additional option when it comes to imputing your data. New tools and parameters will also be offered, on a voluntary basis to volunteers who wish to deepen their surveys. Please note that we provided more precise conclusion and recommendation to certain lakes. These lakes had sufficient data to express a problematic and perhaps some potential recommendation to better its situation. On the other hand, some lakes report will still have more general conclusion. Although all of them are more personalized than last year, some will require a third year of sampling to establish a clear conclusion and recommendations. Keep in mind that as we obtain more and more data, the conclusions and actions required will become more and more specific to each lake.
Do not worry, activities and information session will be offered before the beginning of our third sampling season to ensure that all participants are comfortable with the new material.
We will reach out to each of you in April in order to validate your interest in participating in the program for a third consecutive year or for a second one for the new participants! Until then, if you already know that you wish to participate, do not hesitate to send us an email confirming your participation and the name of the lake targeted. This will allow us to start filling up the roster for the 2023 season.
We want to thank each and every one of you who participated in the program this year. Without your participation, the number of lakes we target would be much smaller. We love working with all of you and we wish you all a happy new year!
We also wish to remind you that we are always available to discuss the reports, water quality, or any other environmental aspect, project, or subject you wish to discuss. We often participate in lake association meetings and encourage association to utilize this resource and invite us to their meeting if they wish!
Cordially,
SAMANTHA RHAINDS
Cadre-conseil à l’environnement
Service de l’Environnement et de l’Urbanisme
Municipalité de Val-des-Monts
1, route du Carrefour, Val-des-Monts (Québec) J8N 4E9
Tél. : 819 457-9400, poste 2228 Téléc. : 819 457-4141
samantharhainds@val-des-monts.net
————————————————————————————————————–
Water testing Lac Grand rapport 2022
Environment, Spring 2021
Water quality
The ice went out of the lake Spring 2021 in mid-April. Water samples were taken at the five traditional sites on May 6thth. Three samples were taken at each location and the test results were averaged. The results are included in the table below:
Spring Total Phosphorus testing ~Grand Lake
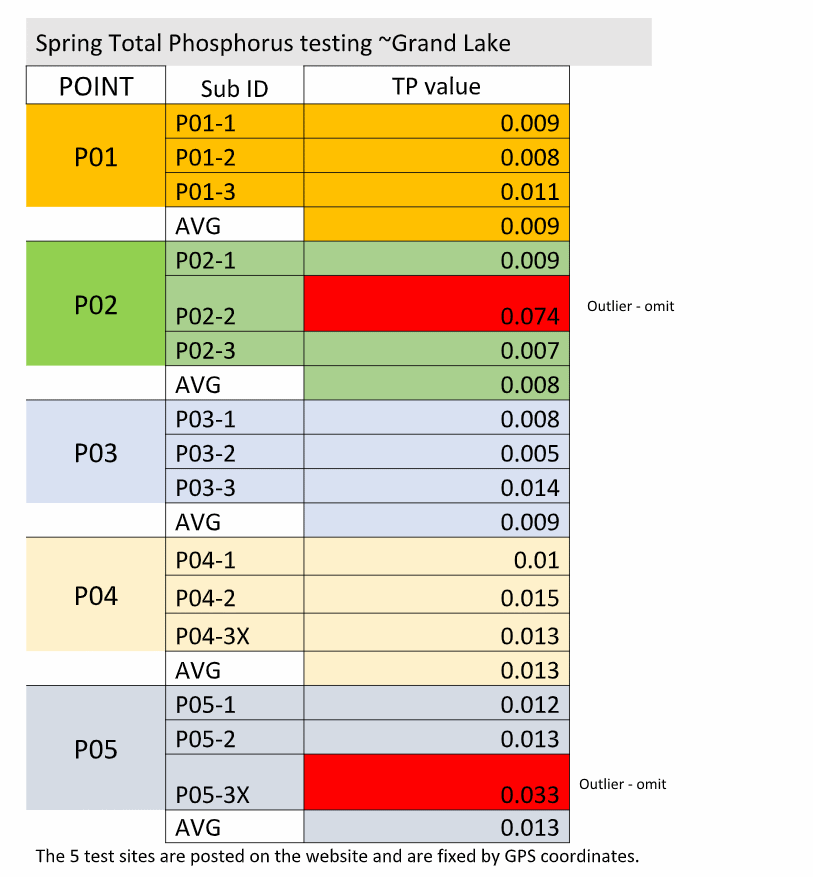
Interpretation
Phosphorous ~ while the results indicate an notable increase over last year, a review of past results does show that there have been previous peaks of equivalent magnitude. But behind occasional spikes, the 20 years of data which we have shows a clear upward trend over this timespan, which should be the focus and concern of us all.
Last year’s numbers show a down-spike, which could have been attributable to a few factors, including: 1) due to COVID restrictions the spring testing was done later than usual….i.e. further from the target of “as-close-to-ice-out as possible.” 2) less boat traffic at that point, for the same reasons.
Milfoil ~ Still of great concern is the constantly increasing spread of European milfoil. This is an invasive species which is difficult to control, but which is frequently assisted by careless human activity, most commonly, boat traffic through milfoil patches. This results in quantities of milfoil “cuttings” which are capable of drifting with currents, settling to the bottom in a new site, rooting, and spreading further in this new location.
Mitigation of milfoil is a responsibility that we all must share.
Developments in water testing program and protocols
The Municipality of Val-des-Monts has undertaken a centralization of water testing in our lakes.
Details can be found on the website => Municipality of Val-des-Monts
The Coles Notes version is that they have hired a staff biologist who has developed a cadre of volunteers on most of the lakes who will perform an enhanced program of water testing.
Among the advantages of this approach are:
1) continuity of recording.
2) standardized methodologies.
3) professional guidance and an increased scope of testing.
This program has great potential, and we are optimistic that the implementation will be successful.
The way forward (substantially the same content for the past 3 years of newsletters…. but still valid!)
The direct link between human activities on a lake and phosphate increase/water clarity decrease is irrefutable. Short of Draconian measures, which would be totally unrealistic and unsupportable, there is really no action that will halt or reverse the gradual degradation of the lake without complete buy-in and cooperation of all lake residents. Simply, water quality and environmental stewardship is and will be the responsibility of all of us.
The three most significant contributors to this degradation are shoreline erosion, chemical runoff, and careless operation of boats.
The three most effective countermeasures to which we can all contribute are:
- Maintain your shoreline in the most natural state possible. Native vegetation does an effective job of retaining many of the products of surface run-off, particularly phosphates and nitrates, and offers some protection against shoreline erosion.
- WYW ~ Watch your wake. There are still a number of boaters who seem completely unaware of the serious impact of their wakes on the lake shoreline. The Grand Lake Association Boating Guidelines were not formulated as an attempt to restrict fun or use of the lake; rather, they were intended to acknowledge the large increase in lake population over the years and the need to try to balance the varying uses of the lake with a minimal impact on its ecosystems. Wakes require time and distance to expend their energy, otherwise, the full impact of that energy will be absorbed by the shoreline directly. A wake that drives hard onto shore will drag sediment back into the shallow water, causing silt to cloud the water and gradually smother the bottom.
The first 10 feet of lake bottom supports almost 90% of the aquatic life in the lake. It is not rocket science to extrapolate the importance of protecting that buffer zone.
If you are within 100 feet of shore, you should be travelling dead-slow, and producing no wake.
Try to avoid patches of weed. There is more than likely milfoil within the patch and if it is cut
loose, will continue its invasion of the lake.
- Perhaps the easiest, make “greener” decisions regarding many household products (we are a long way from a municipal drainage system with sewage treatment etc. ) For example, if you operate a dishwasher, consider using an environmentally-gentler brand of detergent….same with laundry soaps. There are many other examples.
Specialty shops now cater to this market niche. In most cases, the cost is comparable to “less-green” items.
In conversation with the president of a Muskoka area lake association, she described a great result that they achieved by a concerted effort to convince cottagers to use 100% non-phosphate dishwasher detergents.
Most supermarkets have products of this type; it is an easy switch and most users found that the performance was as good or better than the phosphate-containing types.
2020
Water Quality
The ice went out of the lake in Spring 2020, in late April.
Due to the restrictions caused by the pandemic we were unable to perform the normal ice-out testing until May 19th.
Three samples were taken at each location and the test results for Total phosphorous were averaged.
The results were:
Culbute Basin – 9.0 North Basin – 9.0 ;
South Basin – 4.0 , South-east basin- 7.0 South-west basin– 4.0 .
May 29th, we completed the testing in Green Lake, taking samples at two sites.
The averaged analysis was: Site GL-01 ~ 16.0 and GL-02 ~ 19.0
Interpretation
Total Phosphorous ~ Grand Lake – while the results appear to indicate a decrease over last year, a review
of past results does show that there have been previous peaks and valleys of equivalent magnitude. But
behind occasional spikes and dips, the 20 years of data which we have indicates an upward long-term trend,
which should be the focus and concern of us all.
Green Lake – Our testing history on Green Lake has been erratic and the data is not sufficient to make any
meaningful assessment. We shall try to match Grand Lake testing frequency, but the logistics of accessing
Green Lake will require that we acquire sufficient volunteer assistance from interested Green Lake
residents.
Water clarity ~ While long-time residents often discuss the decrease in water clarity over many decades,
the Secchi Disk results have continued to be consistent with the classification OLIGOTROPHIC: “clear
water with very low levels of phosphates, algae, and nutrients.”
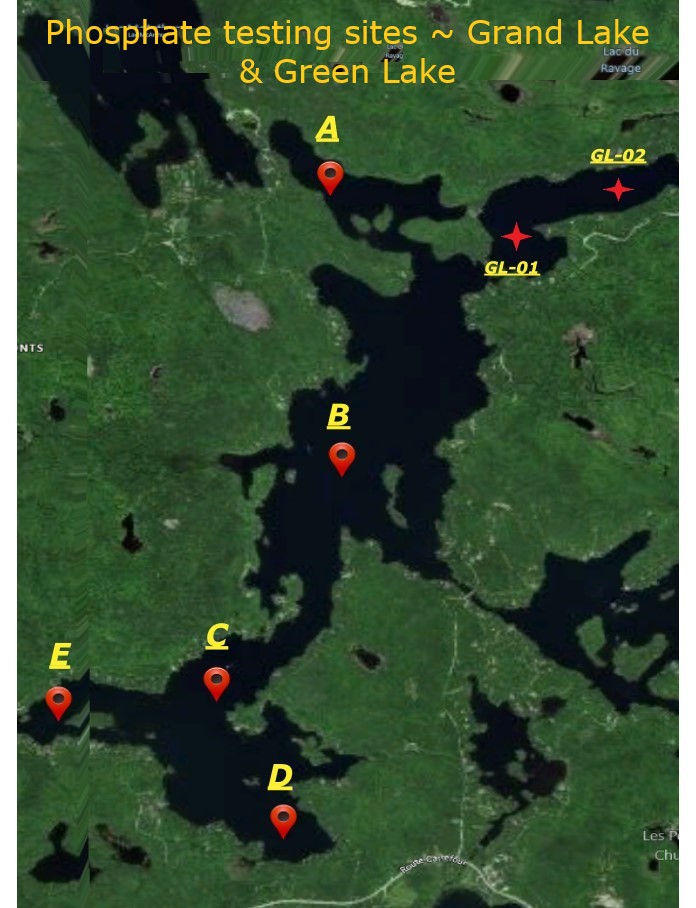
May 2020 Phosphorous Testing Sites _ GPS Waypoint coordinates
2019
The ice went out of the lake, Spring 2019, between May 1-2. Three water samples were taken at each of the five test sites on May 19th; the test results were averaged.
The results were:
Culbute Basin – 9.0; North Basin – 11.0 ; South Basin – 11.0 ; Southeast Basin – 11.0, and Southwest Basin – 5.0 .
We will test again for phosphorous in early July and September, and for
fecal coliforms in early July and mid-August
For more detail see the Spring Newsletter.
Previous Tests
|
Années/Years |
2007 |
2008 |
2009 |
2010 |
2011 |
2012 |
2013 |
Moyenne/ Average |
|
Lac/Lake |
||||||||
|
Achigan |
3 |
6,3 |
– |
3,3 |
6,3 |
7,3 |
6,0 |
5,4 |
|
Baie Mud |
– |
– |
– |
11,3 |
– |
– |
– |
11,3 |
|
Barnes |
9,2 |
– |
6,6 |
5 |
11,7 |
9 |
15,7 |
9,5 |
|
Bataille |
11 |
5 |
11,7 |
4,6 |
14 |
9,5 |
9,5 |
9,3 |
|
Bonin |
6,5 |
– |
– |
– |
2 |
– |
– |
4,3 |
|
Bois-Franc |
– |
– |
5,6 |
– |
2 |
– |
– |
3,8 |
|
Brassard |
7 |
4 |
7,6 |
3,8 |
2,3 |
7 |
6,7 |
5,5 |
|
Champeau |
4,7 |
11,7 |
6 |
6 |
7,7 |
17,3 |
– |
8,9 |
|
Chevreuil |
5 |
– |
9 |
7,3 |
15,3 |
10,6 |
– |
9,4 |
|
Clair |
4 |
4,4 |
– |
2 |
8 |
– |
4,7 |
4,6 |
|
Corrigan |
– |
– |
3,6 |
10,3 |
11,7 |
9,6 |
9,0 |
8,8 |
|
Dam |
– |
– |
5,8 |
– |
10,7 |
21,3 |
– |
12,6 |
|
Des Chutes |
– |
– |
– |
– |
18,3 |
– |
– |
18,3 |
|
Dodds |
3 |
– |
– |
– |
– |
– |
– |
3,0 |
|
Écluse |
– |
3,2 |
– |
– |
– |
– |
– |
3,2 |
|
Épinettes |
4,3 |
– |
3,6 |
7,3 |
8 |
8,7 |
6,7 |
6,4 |
|
Gilmour |
12,1 |
3 |
8,1 |
8 |
13 |
35 |
7,7 |
12,4 |
|
Girard |
9,3 |
4,5 |
3,3 |
2 |
12 |
– |
9,0 |
6,7 |
|
Grand |
13,6 |
7,6 |
9,2 |
8,3 |
17,3 |
11,5 |
9,5 |
11,0 |
|
Hardwood |
2,4 |
2 |
2,7 |
2,3 |
6 |
8,3 |
5,7 |
4,2 |
|
Lachaine |
– |
16 |
– |
– |
– |
– |
– |
16,0 |
|
Létourneau |
6,7 |
6 |
– |
– |
6 |
– |
– |
6.2 |
|
Louise |
6 |
– |
3,3 |
3,3 |
9 |
7,3 |
6,7 |
5,9 |
|
Main |
– |
– |
– |
– |
14 |
– |
– |
14,0 |
|
Marbre |
3,2 |
4,5 |
– |
4 |
3,3 |
9,3 |
6,5 |
5,1 |
|
Maskinongé |
– |
13,3 |
4,5 |
7,5 |
12,3 |
14,3 |
9,0 |
10,2 |
|
McArthur |
5,7 |
5,7 |
5,6 |
5,5 |
8,3 |
2 |
7,0 |
5,7 |
|
McFee |
5 |
2 |
– |
2 |
6,6 |
5,1 |
4,5 |
4,2 |
|
McGlashan |
5,7 |
4 |
2 |
3 |
10,7 |
– |
6,7 |
5,3 |
|
McGregor |
16,5 |
7,6 |
11,3 |
5,3 |
18 |
– |
4,2 |
10,5 |
|
McMullin |
25 |
18 |
– |
– |
28 |
– |
– |
23,7 |
|
McNicole |
– |
– |
– |
– |
12,3 |
– |
– |
12,3 |
|
Perdrix |
22 |
– |
16,3 |
25,8 |
18,2 |
25,7 |
8,7 |
19,4 |
|
Petit Lac Clair |
6 |
9,3 |
6,6 |
7,3 |
– |
– |
– |
7,3 |
|
Rhéaume |
16,2 |
– |
13,7 |
7 |
14,7 |
13,1 |
10,8 |
12,6 |
|
Robinson |
– |
11 |
– |
– |
– |
– |
– |
11,0 |
|
St-Antoine |
– |
– |
– |
– |
10,7 |
– |
13,4 |
12,1 |
|
St-Germain |
2,7 |
2 |
2,5 |
2,8 |
7 |
8 |
6,4 |
4,5 |
|
St-Pierre |
7,3 |
8,2 |
9,1 |
– |
13 |
20,9 |
8,4 |
11,2 |
|
TenPenny |
– |
– |
4,3 |
11,3 |
7 |
27 |
2,0 |
10,3 |
|
Truite |
– |
3,3 |
14,6 |
3,7 |
9,7 |
5,6 |
8,3 |
7,5 |
|
Twin |
6,7 |
– |
– |
– |
– |
– |
– |
6,7 |
| Figure 1 : Phosphore des lacs en µg.L-1 (23 lacs échantillonnés en 2013 | ||||||||